September 1, 2026

From Video Monitoring to Store Insights: How Panoramic Cameras Support Department Store AI Analytics

Author

Date

September 1, 2026

Share


Turning department store video into customer flow, heatmap, parking, and operation insights.

In a proof-of-concept for a large department store environment, Cupola360 provided 360° panoramic cameras as the site video source, working with a third-party AI video analytics platform to evaluate how visual data could support customer flow analysis, site awareness, security automation, and operation planning.


For department stores, the challenge is rarely a lack of cameras. Entrances, signage areas, exhibition zones, parking facilities, and public spaces are often already covered by different video sources. The real question is whether those video feeds can move beyond monitoring and playback to become useful operational insight.

The Challenge: Department Stores Need More Than Monitoring

Large department stores are complex operating environments. Visitor flow at the entrance affects wayfinding and staffing. Dwell activity near outdoor signage influences media value and advertising schedules. In-store heatmaps reveal which displays attract attention. Parking data helps explain arrival behavior and visitor patterns.


When these signals are scattered across separate cameras, reports, or management systems, operation teams may struggle to understand how they connect. A busy-looking area does not always mean every display is effective. Parking peaks may not align with entrance traffic peaks. A high-traffic signage area does not necessarily mean visitors are stopping or engaging.


This is why department stores need more than additional video feeds. They need a connected visual analytics architecture that can bring together video, events, customer flow, dwell behavior, heatmaps, and parking data.


When visual data becomes structured and readable, video is no longer only a record of what happened. It becomes a decision-making layer for department store operations, marketing optimization, and site management.

The Solution: Multi-Zone AI Video Analytics Validation

This POC validated AI video analytics across multiple department store zones, including main entrances, outdoor signage areas, in-store exhibition zones, and underground parking facilities. The applications included dwell detection, crowd gathering alerts, environmental anomaly monitoring, pedestrian traffic counting, license plate recognition, vehicle counting, automated reporting, audience profile analysis, and heatmap visualization.


Instead of treating video as isolated footage, the system converted visual inputs into measurable, reviewable, and extensible operational data. This helped the retail team understand traffic rhythm, dwell behavior, area engagement, parking flow, and safety-related events across different parts of the site.


During the POC, nine key tasks were completed and passed validation, demonstrating system adaptability and stability in a complex retail environment.

Main Entrance: Building a Baseline for Customer Flow

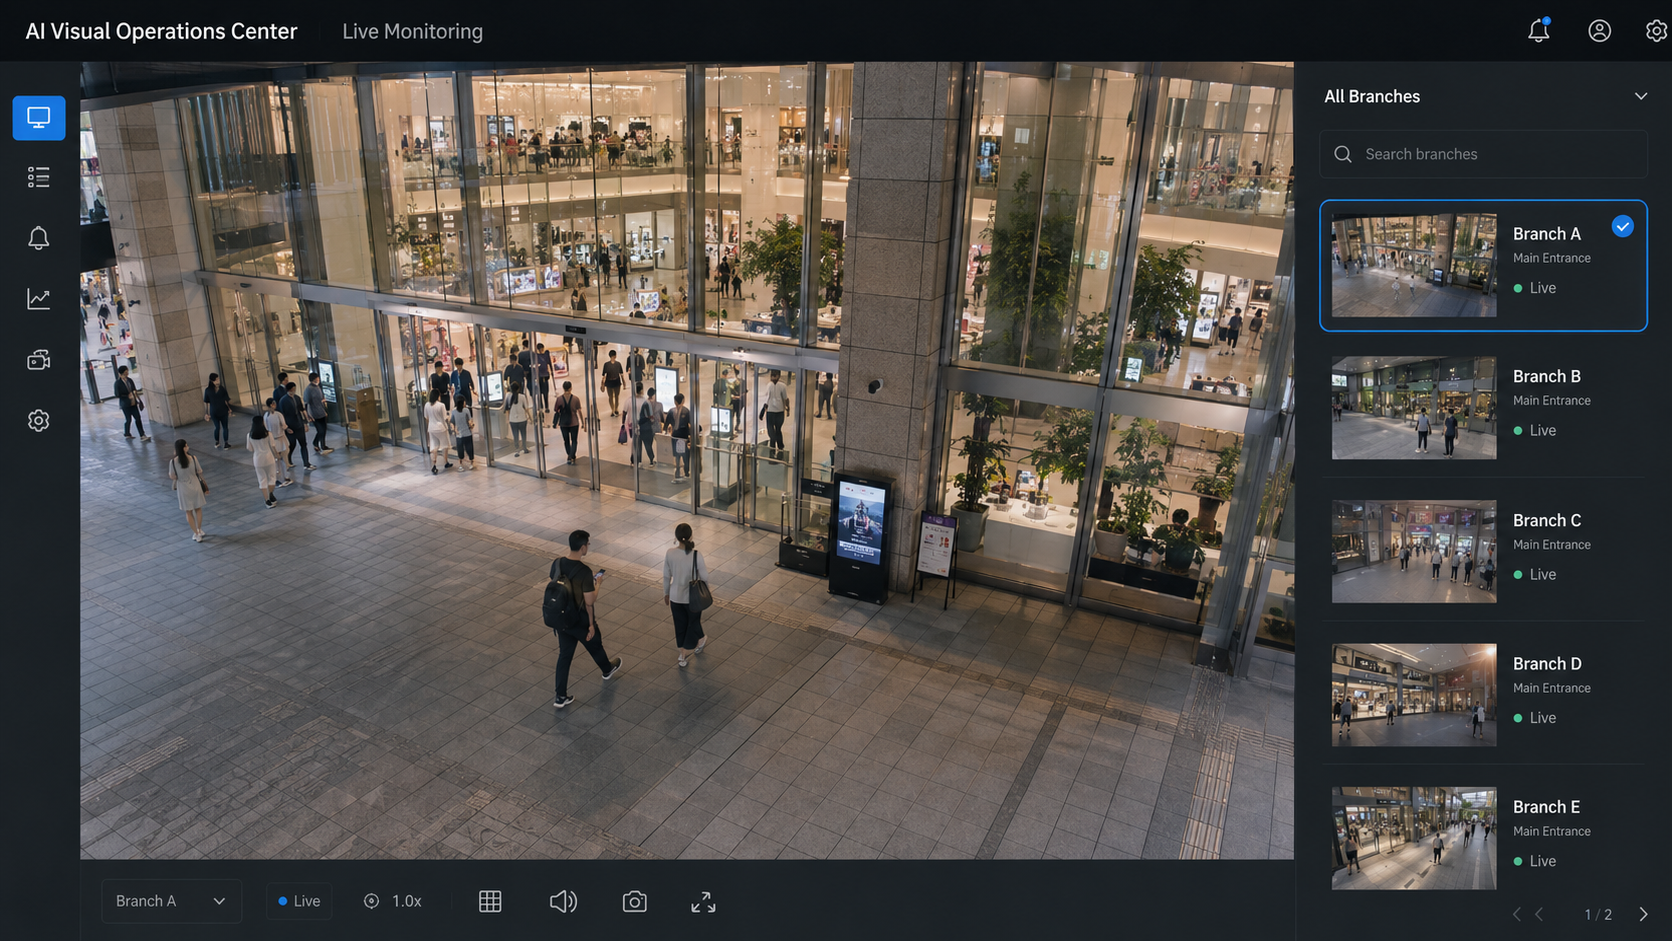
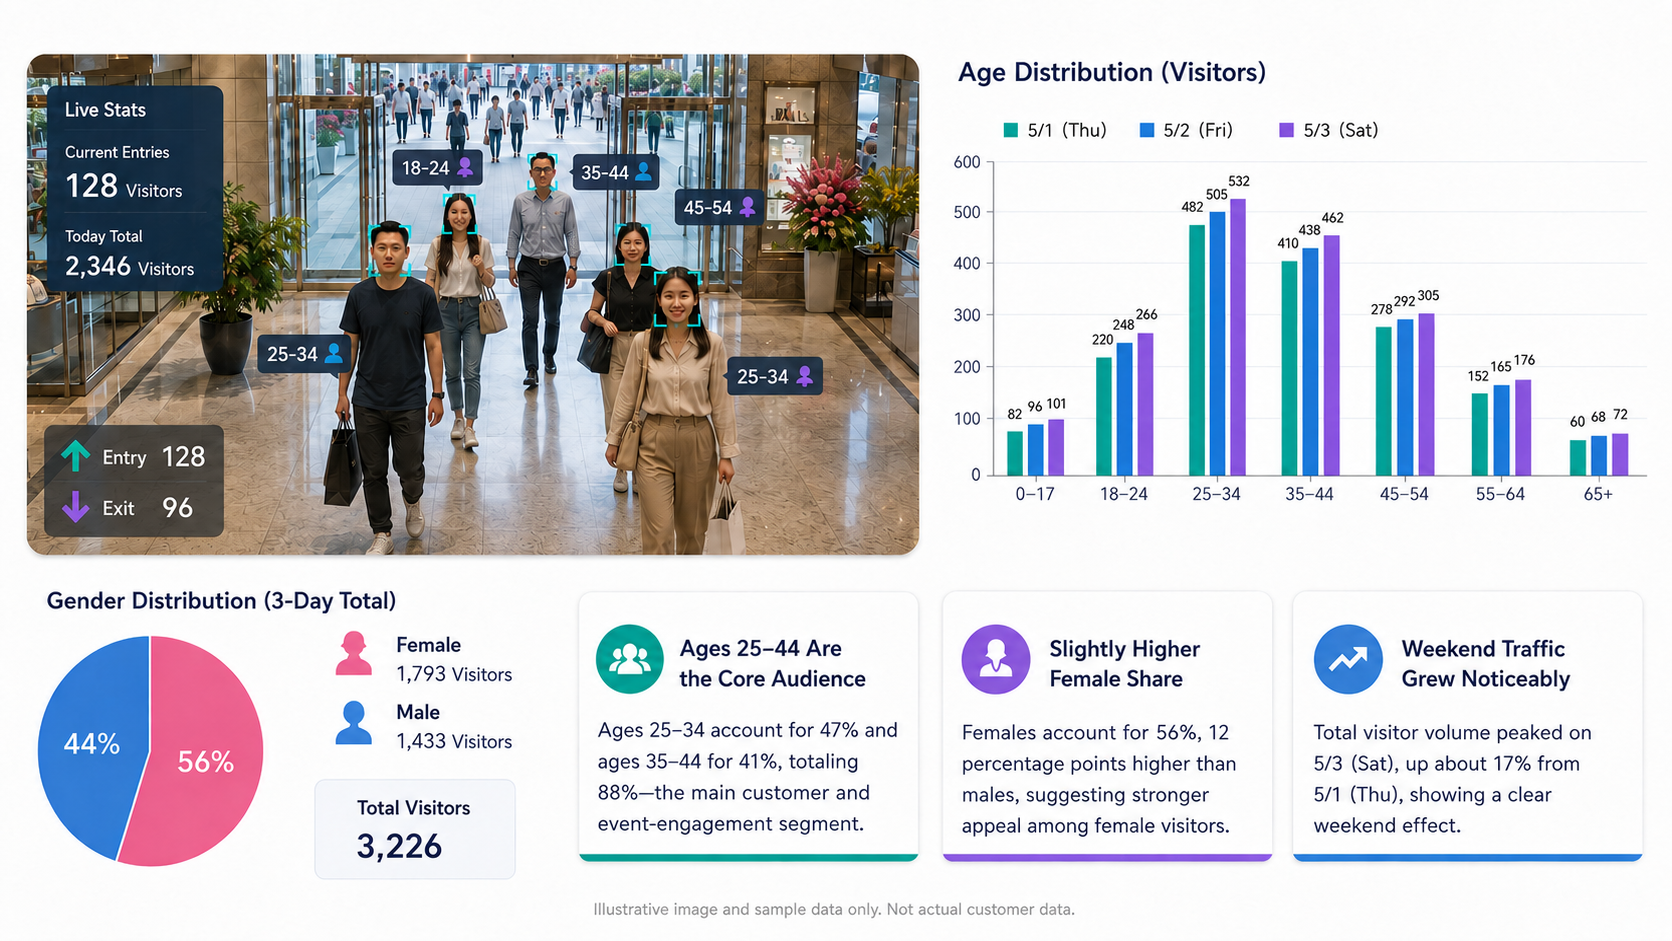
The main entrance is one of the most important operational data points in a department store. Through AI video analytics, the system can count people entering and exiting in real time, generate total traffic numbers, and support reporting by hour, day, week, or month. The data can also be exported to Excel for operational analysis.


This helps department store teams establish a customer flow baseline and understand how visitor volume changes across different time periods, dates, campaigns, or events. When traffic data is combined with audience profile analysis, it can further support staffing, event planning, wayfinding, floor guidance, and marketing decisions.


In this POC, the main entrance area validated pedestrian counting, age and gender analysis, and audience profile applications.


For public-facing communication, this type of capability should be described as anonymous audience profile analysis or customer flow analytics, rather than emphasizing personal identification. For department store operators, the real value is not tracking a specific person. It is understanding overall visitor flow, audience composition, and time-based behavior patterns..

Outdoor Signage: Turning Exposure into Dwell-Time Insight

Outdoor signage is not only about how many people pass by. For retail media and brand communication, a more useful question is whether visitors actually stop, stay, and engage with the display area.


In the POC, the outdoor signage zone was configured for dwell detection. When a person stayed within the detection area beyond a defined threshold, the system generated an alert record.


This type of data helps department store and retail media teams evaluate signage performance, media placement, visual design, and content scheduling. Instead of relying only on estimated exposure or location-based assumptions, operators can better understand when and where people are more likely to stop.


The report also suggested that dwell-time peaks could be used to support dynamic advertising schedules, such as displaying high-impact brand content during high-dwell periods or using specific time windows to promote floor guidance and retail offers.


With AI video analytics, outdoor signage can become more than a static media asset. It can become a data-informed touchpoint connected to real customer behavior.

In-Store Exhibition Zone: Understanding What Actually Attracts Visitors

The in-store exhibition zone was one of the most valuable retail operation scenarios in this POC.


Crowd gathering detection can automatically trigger alerts when the number of people in a defined area exceeds a preset threshold.


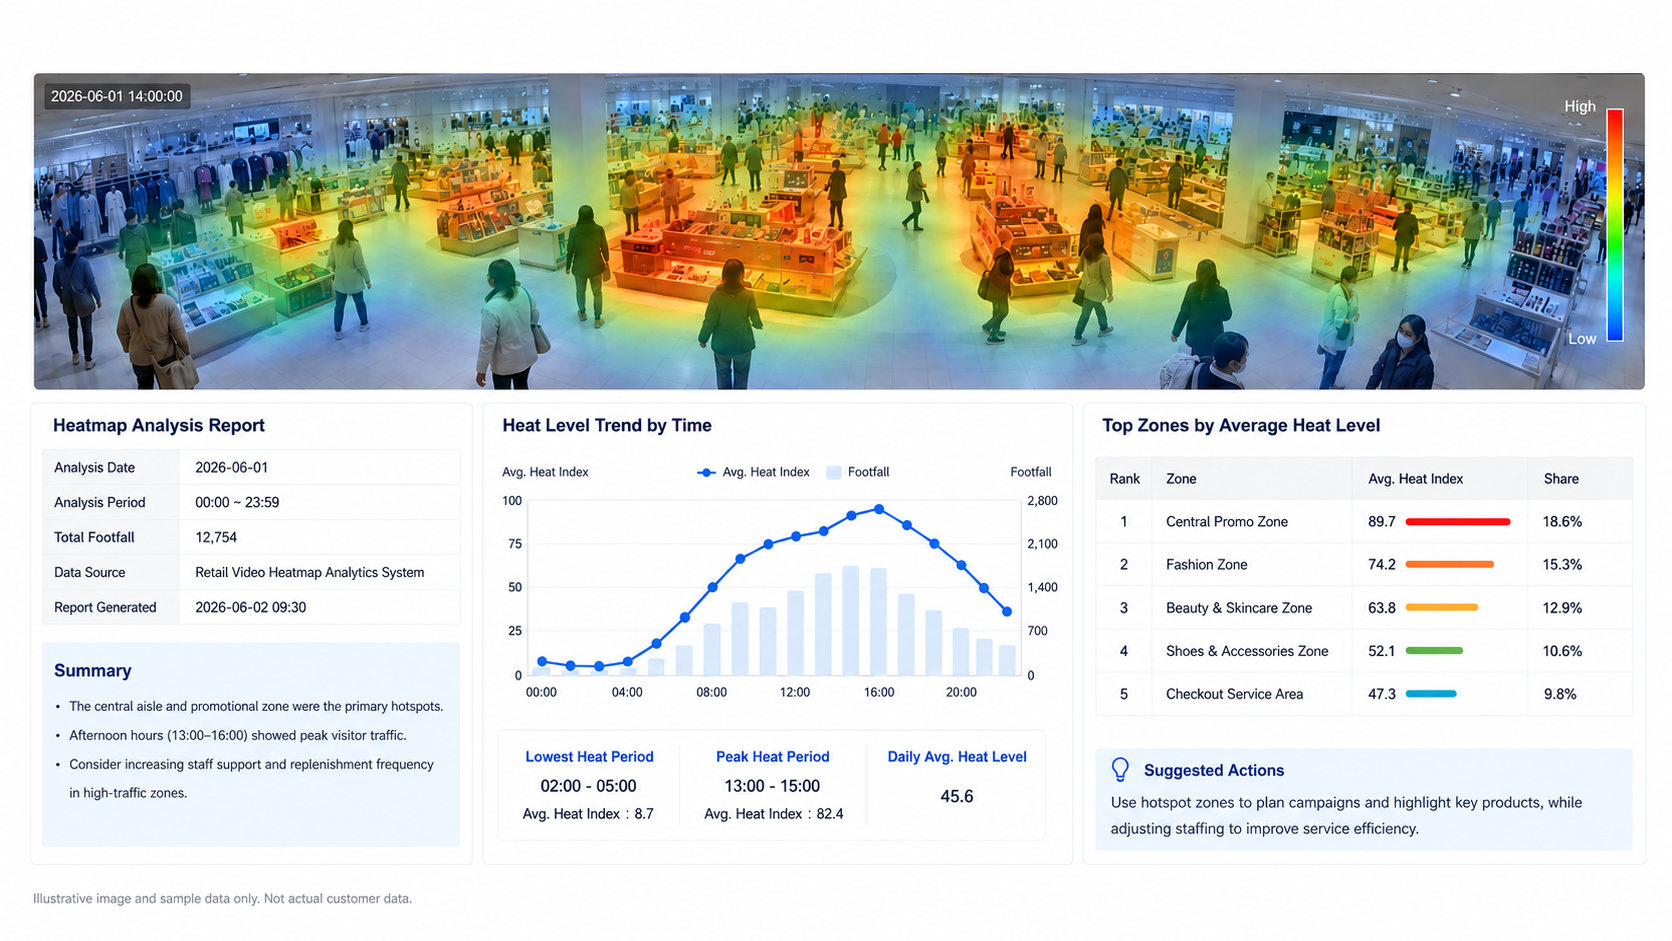
Heatmap analysis can also generate hourly or summarized heatmap views, showing where people or objects are distributed within the video scene, with Excel export available for further analysis.


For department store operation and event planning teams, heatmaps help turn subjective impressions into measurable insight. Instead of simply saying an area “felt crowded,” operators can identify which display zones attracted the most attention, which areas were mainly used as walkways, and which layouts may need adjustment.


The POC analysis showed that specific display areas generated stronger dwell activity, while certain time periods became high-engagement windows for product launches, limited-time offers, or pop-up activities.


This type of insight can support pop-up planning, product display optimization, campaign scheduling, traffic guidance, and retail space design.

Parking Area: Connecting Vehicle Flow with Customer Behavior

Parking facilities are often an overlooked source of department store intelligence. In reality, parking traffic, vehicle types, peak arrival periods, and dwell behavior can reveal important differences in visitor patterns.


In this POC, the parking area validated multiple applications, including dwell alerts, environmental anomaly monitoring, license plate and vehicle model recognition, vehicle counting, and fire or smoke detection.


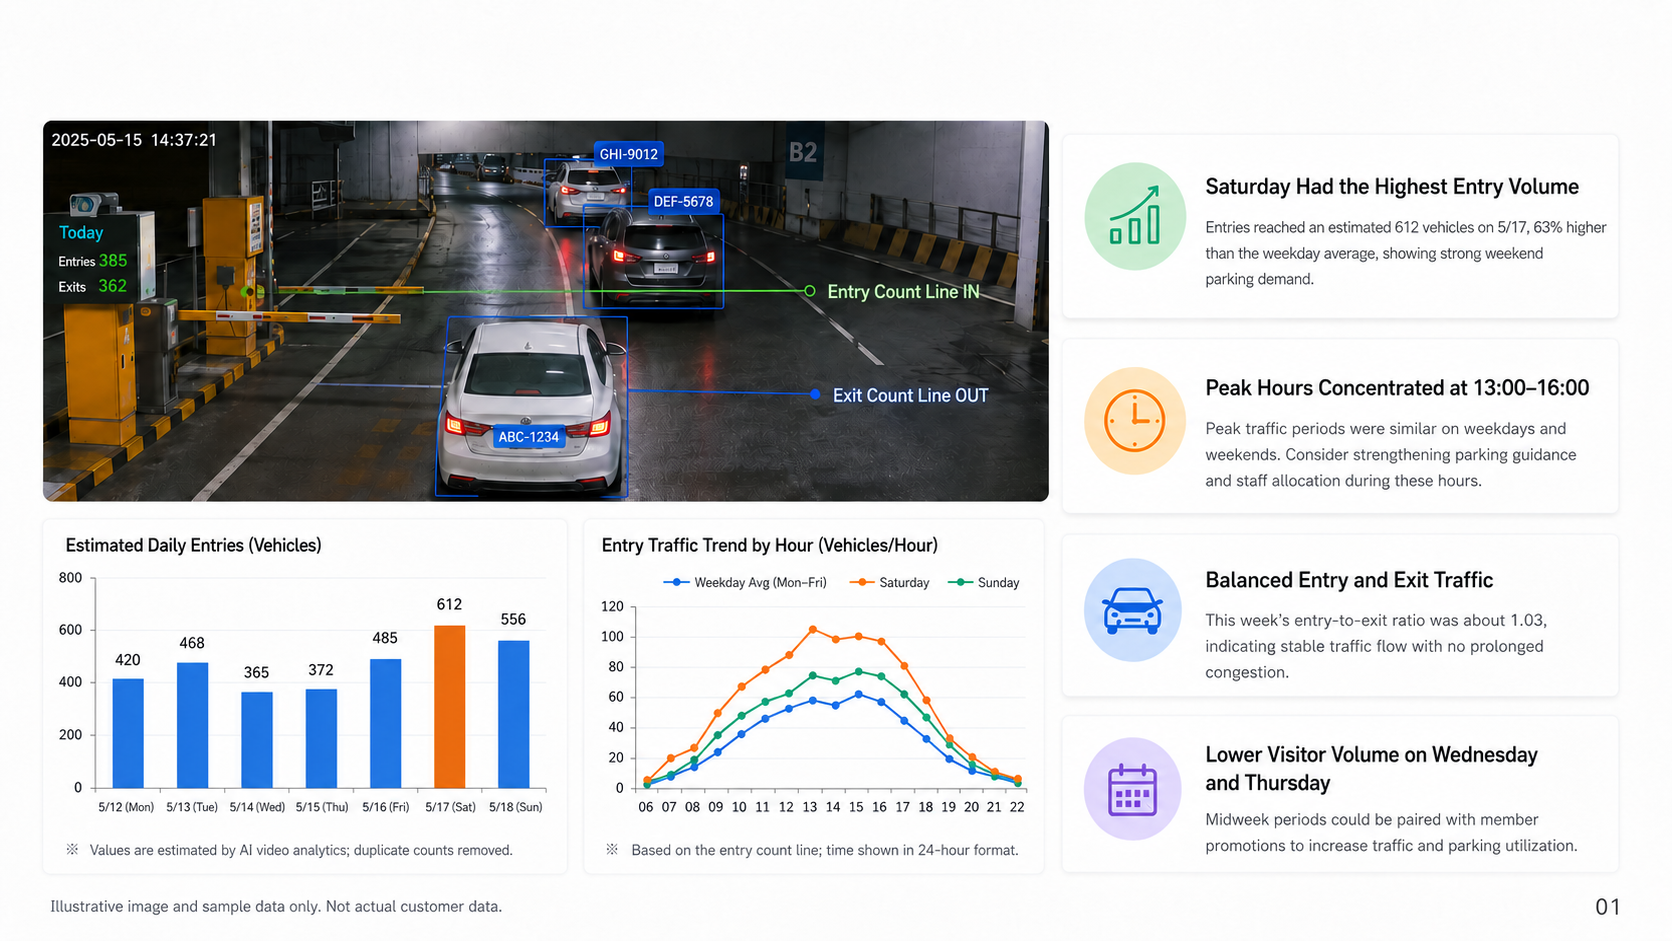
Vehicle counting can support reporting by different time ranges and classify multiple vehicle types, including bicycles, trucks, cars, motorcycles, and pickups.


This helps operation teams understand parking pressure, peak arrival periods, and differences between visitor groups. The POC analysis also found that parking peak hours and entrance traffic peak hours may not fully overlap, suggesting that drivers and public-transport visitors may follow different arrival and shopping patterns.


For department store operators, this type of cross-zone insight is especially valuable. It can support parking operations, segmented marketing, entrance-specific wayfinding, floor activity planning, and time-based promotion strategies.

From Video Monitoring to Department Store Site Intelligence

The value of this POC was not only in validating individual AI functions. Its greater value was showing how different department store zones can be connected through visual intelligence.


The entrance provides traffic rhythm.

Outdoor signage provides dwell and exposure signals.

In-store exhibition zones provide engagement and heatmap data.

Parking areas provide vehicle flow, visitor pattern, and safety event information.


When these signals are viewed together, department store teams can better understand how visitors enter, move, stay, interact, and leave. Video becomes more than a playback tool. It becomes a data source for operations, marketing optimization, and site management.


The proposed next steps in the POC included connecting live cameras, building automated daily traffic reports, integrating parking management systems, connecting POS data for conversion analysis, supporting dynamic advertising schedules, conducting regular heatmap analysis, expanding to additional locations, and building a unified AI video operations center.


This also shows that AI video analytics does not need to be deployed all at once. Department store operators can start from key zones, validate priority use cases, and gradually expand into a more complete intelligent operation workflow.

System Validation and Deployment Flexibility

From a technical validation perspective, the POC achieved real-time processing, with alert-trigger latency of less than one second. It also supported multi-channel video analysis without affecting system stability.


The report also noted that real-world deployment requires site-specific tuning. Outdoor lighting, low-light parking conditions, complex backgrounds, and false-positive reduction all need to be considered when deploying AI video analytics in department store environments.


The validation used short video clips to simulate streaming, while the technical architecture remained consistent with future physical camera integration. This means the validated workflow can be migrated and scaled when connected to real camera sources.

How Cupola360 Supports This Application

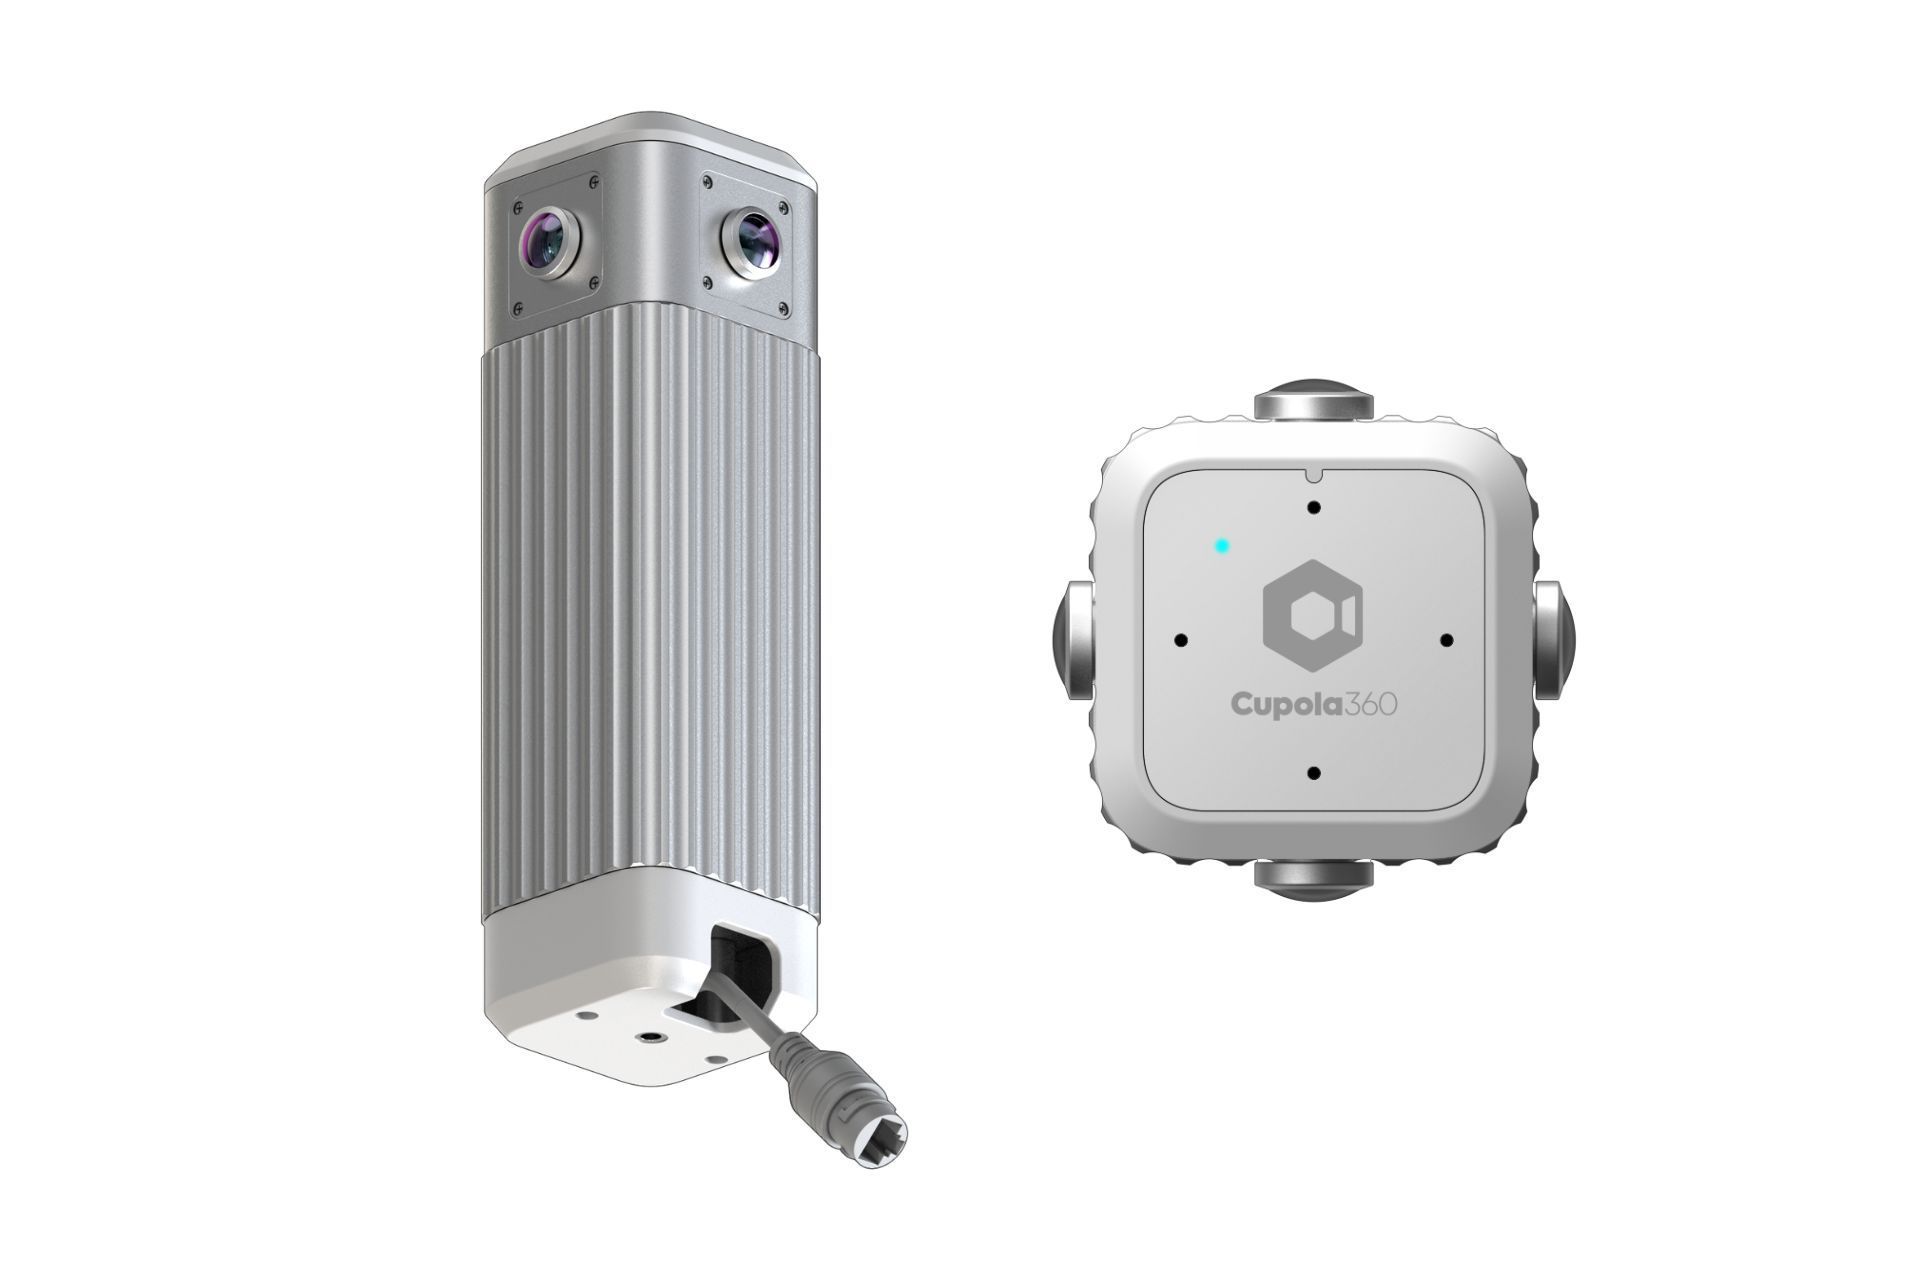
In this department store POC, Cupola360 provided 360° panoramic cameras as the site video source, enabling a third-party AI video analytics platform to access broader visual coverage for customer flow, dwell, heatmap, vehicle flow, and event analysis.


Compared with fixed-view cameras alone, 360° panoramic cameras can capture a wider site context from a single installation point. This helps department store environments collect more complete visual input across entrances, exhibition zones, outdoor signage areas, parking facilities, and other operational spaces.


In this type of application, Cupola360 does not replace the existing VMS, AI analytics platform, or management system. Instead, it provides a panoramic video foundation that allows system integrators, AI video analytics platforms, and department store operation teams to build stronger workflows for customer flow analytics, heatmap observation, parking behavior analysis, and site awareness.

Key Highlights

  • Conducted a POC in a large department store environment
  • Covered main entrances, outdoor signage, in-store exhibition zones, and parking facilities
  • Validated people counting, anonymous audience profile analysis, dwell detection, crowd gathering alerts, heatmap analysis, license plate and vehicle recognition, and vehicle counting
  • Completed and passed nine key validation tasks
  • Supported real-time alerts with less than one-second trigger latency
  • Turned visual data into insights on customer flow, dwell behavior, heatmaps, vehicle flow, and site alerts
  • Can be extended to automated reporting, POS conversion analysis, dynamic advertising schedules, and unified AI video operations
  • Suitable for department stores, shopping malls, large retail sites, exhibition zones, and multi-location retail operations

Related Resources

Related Articles

August 4, 2026
See how DP Smart uses Cupola360-powered 360° live streaming to build a scalable public-facing live view network across tourism sites, public spaces, traffic points, events, venues, and community activities.

Taroko Smart Tourism
August 4, 2026
See how DP Smart uses Cupola360-powered 360° live panorama technology to build a smart tourism live image platform for Taroko, supporting visitor previews, real-time scenic views, and remote site awareness.
July 3, 2026
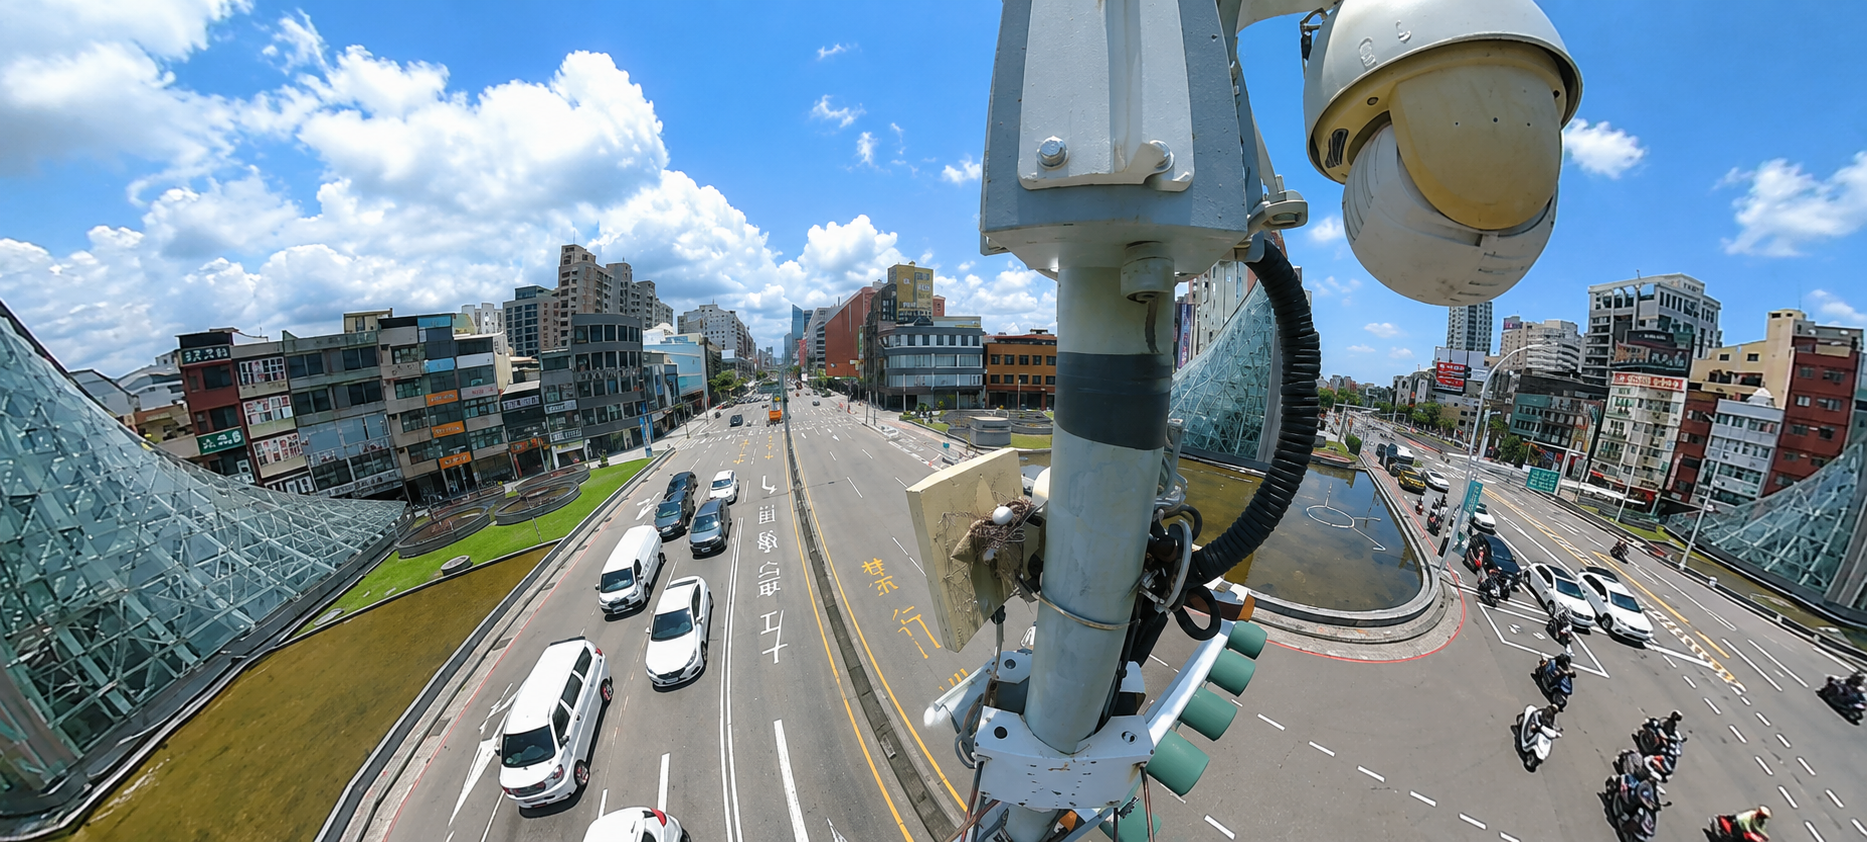
See how 360° panoramic cameras can complement traditional traffic cameras, map-based platforms, road status layers, and event information for smarter city monitoring.
By emel July 3, 2026
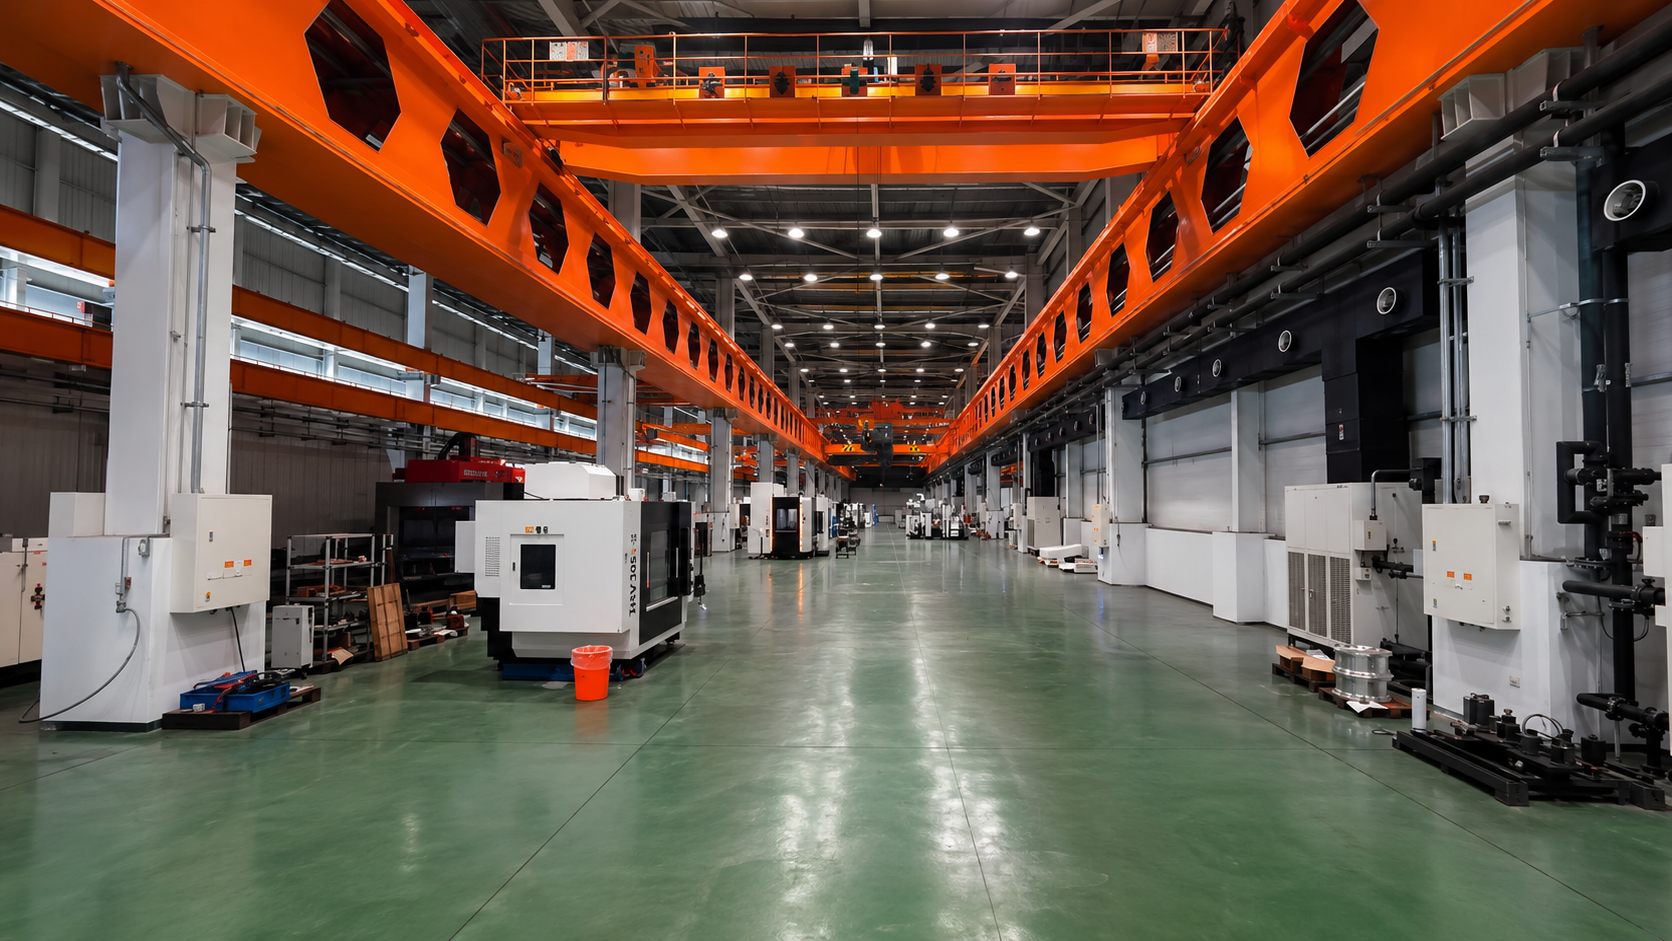
See how YCM introduced a panoramic smart inspection system with Cupola360 and DotZero to support production visibility, PPE recognition, safety alerts, and gesture-based work reporting.
July 2, 2026
See how YCM introduced a panoramic smart inspection system with Cupola360 and DotZero to support production visibility, PPE recognition, safety alerts, and gesture-based work reporting.
June 12, 2026
See how 360° panoramic vision and AI-assisted detection support cashier operation monitoring, cash drawer alerts, transaction review, and smarter retail store management.
June 12, 2026
See how Ingrasys deployed Cupola360 RX1000F panoramic cameras with AI, SFC data, dashboards, and remote management tools to support smarter factory operations.